Saturday, October 12, 2019

Bad graphs are everywhere - this time it's Khaleej Times

Nobody sets out to make a bad graph. But it happens. Again and again. It happens in places where you would expect people to know better.

Let's look at the following example from Khaleej Times published on Oct 11 in the business section:

Khaleej Times (Oct 11, 2019 Page 14)
Khaleej Times (Oct 11, 2019, Page 16) 
Storytelling is an art. The art is further exemplified when the storytelling involves data. The story in the article could have been told differently to resonate better with the readers. However, I'll focus on the following chart from the article to discuss the basics of data visualization.


Let's analyze this chart:
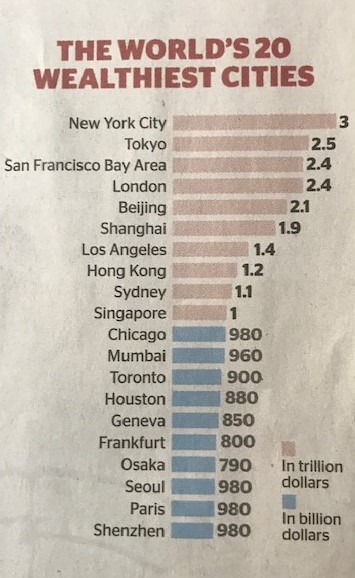
  1. This is a horizontal bar chart, which flips the vertical bar chart. The horizontal bar chart is easier to read especially when the category names are long (e.g. San Francisco Bay Area).
  2. The chart is easy to read because of the way we typically process information - starting at the top left and making z's with our eyes across the screen or page - the structure of the horizontal bar chart is such that our eyes hit the category names before the actual data. 
  3. The chart uses the logical ordering of categories by ordering the cities in descending order (and not alphabetically) 
The 'bad elements' that wreck this chart:

  1. The data is presented in Trillions but the color coding distinguishes it based on Trillions and Billions. The size of Singapore is 1 Trillion whereas Chicago is 980 Billion. It is not very obvious when you read the chart - a higher number (980) is placed below a much smaller number (1) 
  2.  The data for billions seems to be entered manually and there is an inconsistency in the data  and bar size for Seoul, Paris and Shenzhen (980 billion each) whereas bar is the same as Osaka (790 billion) 
  3.  Distinguishing trillions and billions add nothing to the story that the data is trying to communicate. In fact it confuses the reader. Color is a very important affordance in design and makes it obvious to the reader on how the product (in this case the data or the chart) is to be used. Pre-attentive attributes are used to draw the reader's attention to where we want them to focus - in other words to high light the important stuff.
  4. The title of the chart does not indicate what the data indicates. $ 3 trillion or $ 980 billion means what ? Is it the overall GDP of the city or the overall wealth of the individuals ? It is not very clear from the chart. 
  5. The color used in the chart places more emphases on the countries with blue bars. The hue of peach color has less pre-attentive attribute than hue for blue color. 
  6. The number orientation is not very consistent. Some numbers are mentioned with no decimal (3) and some are presented with one decimal. Changing the number from trillion to billion is a disaster which we have already discussed. 
  7. The message in second part of the article - The Big Apple Rules: New York has 65 billionaires and over 380,000 millionaires as residents is not coming out clearly in the chart. In fact if the person does not read the second part of the article, the message is completely missed. 
Let's try and see how we can improve the affordances of the chart:


  1.  The chart title is altered to indicate what the data means 
  2.  Sub-heading is added to give context of the data that needs to be highlighted 
  3.  Color is used as a pre-attentive attribute to highlight New York city
  4.  Top 10 countries are colored in Blue (other than New York) and the next 10 are de-emphasized by using a grey color 
  5. The data is presented in consistent terms - 2 decimal and one measure of currency is used 
  6.  Legend for currency is placed close to the first bar for ease of readibility 
  7. No color legend is given, the color used (orange, blue and grey) signals the emphasis of data
  8. The color used are color blind safe 

The focus of this article was to highlight the inconsistencies in the chart and not analyze the effectiveness of storytelling, which is another interesting perspective to analyze. The article talks about 'Why Dubai matters to the rick' but does not indicate how Dubai is placed in the ranking of world's wealthiest cities. The credibility of the story is lost if it fails to gives the complete picture and shares  information selectively. 

We have the best tools available today for preparing 'sexy' looking charts. However, storytelling is an art and cannot be automated by the tool. Stories resonate and stick with us in ways that data cannot.

Saturday, February 20, 2016

7 Global Economies that are increasingly looking addled and distorted due to low interest rates


Central Bankers across developed economies seem to believe that there is an interest rate so low that resultant financial market wealth will ultimately spill over into the real economy.  The negative aspects of low yields and financial repression are making the following economies increasingly addled and distorted:

1.       Venezuela

Bankruptcy just around the corner due to low oil prices and policy mismanagement. Current oil prices are a function of low interest rate central bank policies over the last 7 years

2.       Puerto Rico

Default underway due to over spending, over-promising of retirement benefits and inability to earn adequate investment returns – due to ultra-low global interest rates

3.       Brazil

In deep recession due to low commodity prices, governmental scandal and exorbitantly high real interest rates to combat the effect of low global interest rates and currency depreciation of the Real.

4.       Japan

260% governmental debt/ GDP ratio – economy failing to kick start even with the booster dose of two of the three arrows from Abe’s armor. Japan is today, what America could be tomorrow

5.       Euroland

‘Whatever it takes’ says Draghi. An economy that lost its spark plug has hit an effective negative interest limit that makes investing in these economies increasingly difficult. Low interest rates beget growth – defies logic in Euroland’s case

6.       China

Debt/ GDP is 300%, loss of USD 1 Trillion in reserves to support an overvalued currency, distorted economic model relying on ghost towns, dirty factories and government spending which never seems to transition to a consumer led growth. Economy looking increasingly addled

7.       U.S.

US economy is in a Black Hole. No one knows how the Fed will handle is enormously expanded Balance Sheet. Housing sector delivered, corporate sector still nonplus and shaky, high yield bonds are back – internally generated growth model seems to be keeping the engine going, for how long – no one clearly knows

Monetary policy is a means and not the only means – out of Abe’s three arrows, most of the central bankers have overused the two arrows of fiscal and monetary policy adjustments. The third arrow – structural changes – lies unused, both in Abe’s and Central Banker’s arsenal.  


Tuesday, June 30, 2015

Boom boom.....bust !


Greece's got some company! American controlled Caribbean island of Peurto Rico is deep in the water and is seeking help from Uncle Sam. Same problems, same consequences - un-competitive economy, bloated payroll and retirement benefits backed by investors from mainland seeking juicy returns. In both cases the parent company i.e. Eurozone in case of Greece and US in case of Peurto Rico does not allow the 'subsidiary' to declare bankruptcy. 


Its going to be chaotic and litigious days ahead. I've ordered a truck load of newsprint and a sack of coffee to sit back, relax and watch yet another 'batting' collapse unfold. 

Long live...Peurto Rico ! Long live Greece !  


Reference Links: 

http://www.bloomberg.com/news/articles/2015-06-29/from-puerto-rico-to-greece-credit-traders-put-on-the-defensive

http://www.bloomberg.com/news/articles/2015-06-29/puerto-rico-will-seek-to-suspend-debt-payments-in-restructuring

http://www.cnbc.com/id/102764396


Monday, June 29, 2015

Sum it up ! : Coming Soon to a market near you – Lehman II


Blogged about #grexit in Feb 2011, things have panned out not very differently....

Sum it up ! : Coming Soon to a market near you – Lehman II:  An alternate view on Greece currency crisis and how Greece should think differently.   Greece should be saying...


Sunday, June 28, 2015

'Corridor talk' : Entrepreneurship lessons from the 'corridors' of IIMA

Entrepreneurship one-liners from the corridors of IIMA.... 


Biggest question for a start-up - Will the dogs eat the dog food

Entrepreneurship is the Pursuit of opportunities without being limited by the resources at hand

Bet on the jockey not on the horse

Tame uncertainty – transfer it to others


There are two moments of truth in the life of a start-up– the first order and the reorders

There are vitamins and there are painkillers, choose what you want to use to satisfy an unmet need


Don’t marry assumptions, divorce them as soon as they get old

Don’t ask the taste of iron from the iron-smith, ask it from the horse

Do not hire the chef before you identify the recipe

If you hire a chef to do X, he will only do X

Say it truthfully, say in completely and say it first

The color of money is more important than the money itself

In a hurricane eve the turkeys can fly


If all I have is a hammer, I treat everything as a nail

A team with B idea > B team with A idea

Would you rather be rich or rather be a king


Rather rule in hell than serve in heaven

Passion for the idea and passion for the business are not the same

Fueling desires lead to more desires

Trust = Credibility + Reliability + Intimacy / Self-orientation

Metcalfe’s law states that the value of a network is proportional to the square of the number of 
connected users of the system.

If the rate of change on the outside exceeds the rate of change on the inside, the end is near

QSQT – Quarter se quarter tak.

If you want to make someone redundant give them inspection jobs

A crisis is a terrible thing to waste

You need big, hairy and audacious goals (BHAG)


If you can’t innovate, be a fast follower

Components of innovation strategy

The place where you add the most value, is also the place where there is the most uncertainty

URL - Ubiquity first, revenues later

Hire for attitude not for skill

Hard is soft, soft is hard

A cleaning lady in the office can tell more about the company, than anyone else in the company

Start-up – is like having a baby – you can read a lot about it, but you have to experience it to know what it really means and what goes with it


I hate curves....the cacophony of 'bell curves'


I hate curves, not the ones on display but the one that most of the HR managers swear by in their year end assessments – the bell curves. If all you’ve got is a hammer, everything looks like a nail; no wonder HR managers eat, drink and sleep bell curves. Recently I was asked to evaluate and suggest the performance appraisal system of a large sized company and what an experience it turned out to be. I realized that most of the HR managers are as possessive about their ‘bell curves’ as Ms. Kardashian is about her B&B (even Microsoft is; – every time I mis-spell her name, it gives me a prompt!)


In the company, I noticed that the actual break up talent literally followed a bell curve:

o   Approx. 20% are A level performers
o   Approx. 70% are B level performers
o   Approx. 10% are C level performers


Although A-level performers were (still are hopefully) adding a lot of value to the company, it was the B level performers who were the heart and soul of the company and are a very interesting bit. The normal hypothesis is that the company is mediocre, because the B level performers are mediocre. However in this case I feel the hypothesis is not true.


A-level performers were small in number and they were relatively new in the company as compared to the B level performers. Also I believed that A-level performers were not likely to be the ones who will stay very long with the company and build up institutional knowledge that is so essential in any business. This makes the B level performers invaluable, as their knowledge base of the company is very deep rooted.  


These B level performers were with the company for long and know the cycles the company has gone through; they understood the company ever better than some of the A level performers. Surprisingly these B-level performers tend to pursue organizational goals over personal ones because they value stability both for themselves and for the company. This fact came out through observation and discussion with a diverse set of people. Irony is that although these B-level performers exhibit such extraordinary patience with career development still because of the compulsions of rating systems we tend to overlook their contribution.  


Besides recognizing and rewarding A-level performers, very few companies have an explicit strategy for recognizing B players, on whom so much of the company’s long-term success depends. Even small gestures go a long way in building the recognition and sense of achievement among B-level employees.

Most of the HODs are themselves A-level players and therefore tend to identify with A-level players in their teams (which is not a bad thing). This is another reason why B-level players are sometimes (in fact most of the times) not given stretch assignments. This also explains the concern of under utilization of employees in certain departments. This under-utilization has a spiraling affect; the employees who are not given stretch assignments grow frustrated that their seniors are not really interested in their career development. Because of mediocre to poor ratings they also don’t believe that HR will represent their best interests.


Possible solution: I suggested to the management a mentor-ship program for B-level employees.  The program can be structured as formal or informal mentor-ship wherein the senior- junior or peer to peer mentor-mentee relationship can be formed to align the aspirations, passions and skills of these B-level employees with the overall objectives of the company. HODs can act as mentors and it can be structured as a voluntary program.

This isn’t just about promotion or increments—it’s much more about developing the potential of the employees who, I definitely feel, form the core in any company’s scheme of long term things.


As for HR managers – their obsession with ‘bells and whistles’ is not likely to fade away anytime soon.  


Monday, April 15, 2013

Why would a specialist want to be a generalist?


Why would a specialist want to be a generalist?

After the moderators hauled the last load of verifications in the third week of December, I finally got a chance to look at the class profile of IIMA PGPX 8 batch for 2013-14. Although privacy issues do not permit discussing class profile at this stage, this article would still be of interest to prospective students of PGPX at IIMA and other one year general management programs.

My first glance at the class profile generated a silent question in my mind – Why would a specialist want to be a generalist? The class profile emitted the themes of diversity, broad knowledge base, exposure to multiple disciplines and specializations with a lot of breadth. But after going through individual profiles, I was on tenterhooks to dissect the generalist v/s specialist conundrum.

Thankfully a knowledge transfer session organized by the outgoing batch was around the corner and I got a chance to volley my conundrum in the ‘green room’. To get a broader perspective on the subject I tried to speak to a diversified sample of X7ers on what value addition they feel a general management program like PGPX provides to people of specialist domains. There was one particular response which stood out and left a lasting impression on my mind.

This wonky X7er served an ace and cleared the air by citing the proverb “To a man with only a hammer, every problem looks pretty much like a nail”. He went on to explain that the man who has various tools will limit bad cognitive effects from the man with a hammer tendency. He made sense but I had a follow up question – How can a ‘specialist’ overcome the hammer tendency and achieve worldly wisdom through this program (read PGPX)?


A letter perfect response to my follow up left me awestruck. The ‘wonk’ stated the matter concisely – for a specialist attaining a worldly wisdom is an ongoing process of, first, acquiring significant concepts – the models – from many areas of knowledge and second learning to recognize patters of similarity among them. The first is a matter of educating yourself and the second is a matter of learning to think and see things differently.  He was candid in acknowledging that acquiring knowledge of many disciplines may seem a daunting task. But he was equally straightforward in stating that fortunately, you don’t have to become an expert in every field. You merely have to learn the fundamentals principles – the big ideas and learn them so well that they are with you always.


So as I take the first step on a pathway towards a goal of flexible thinking and broadening my knowledge base derived from exposure to multiple disciplines, I look forward to understanding the truly big ideas of each discipline and then connecting them back to my specialist domain. I hope to be back on this post after a year to testify on this conundrum from my own personal experience.